How to use Stochastic Oscillator Indicator in Sideways Markets?
The Stochastic Oscillator is one of the most widely used and recognised oscillators for sideways markets. Traders use this indicator for identifying overbought and oversold conditions. This article will tell you how to use the stochastic oscillator in sideways markets with practical trading setups.
Mumbai: You might have observed that most of the time, the market moves between a certain range. It does not form a recognisable trend. When prices move within a fixed range, neither buyers nor sellers dominate the market. This condition is known as a sideways or range-bound market. During such periods, trend-following indicators usually give false signals.
In sideways markets, traders usually rely on momentum oscillators to identify potential entry and exit points. The Stochastic Oscillator is one of the most widely used and recognised oscillators for sideways markets. Traders use this indicator for identifying overbought and oversold conditions. This article will tell you how to use the stochastic oscillator in sideways markets with practical trading setups.
What is Stochastic Oscillator?
The Stochastic Oscillator indicator is a momentum indicator developed by George Lane. It measures the position of the present closing price relative to the price range over a defined period. This indicator relies on the market momentum instead of the price trends.
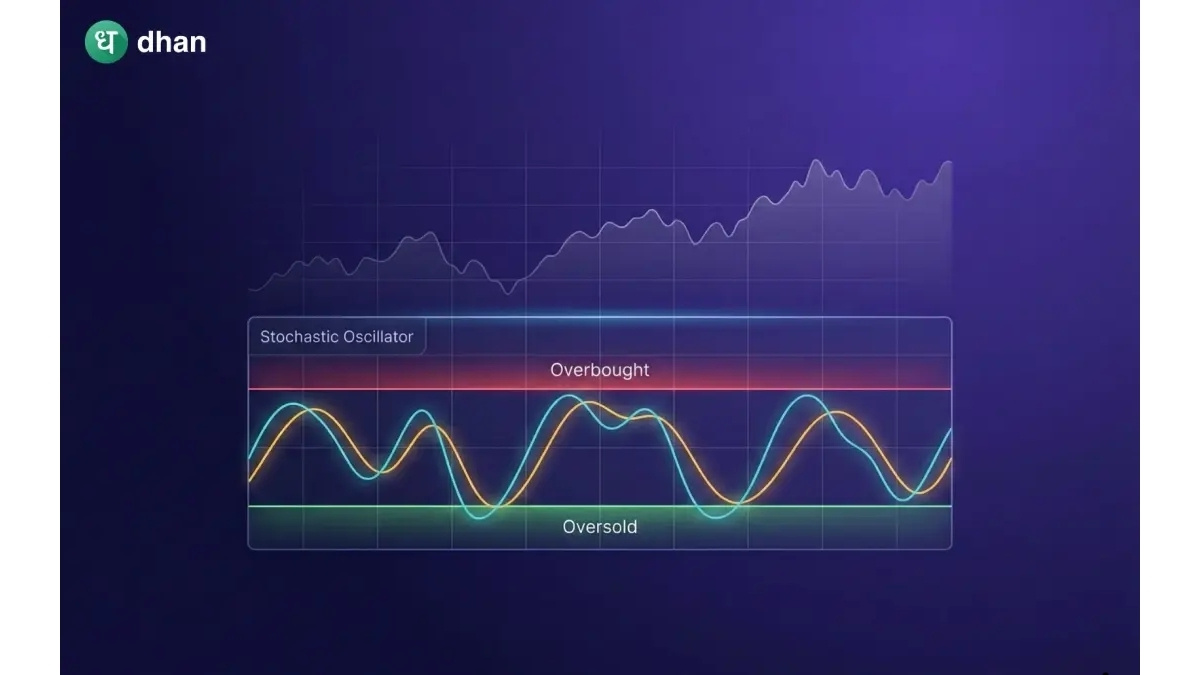
The stochastic oscillator moves between 0 and 100 and consists of two lines:
- %K line – the main stochastic line that reacts quickly to price changes
- %D line – a signal line, which is the moving average of the %K line
Many traders use 14, 3, 3 as a Stochastic setting. This means the indicator analyses the last 14 periods and smooths the data using two moving averages.
There are two zones on the oscillator scale. If the Stochastic Oscillator trades above 80, it is considered that the underlying asset is overbought. If it trades below 20, it is marked as oversold. These levels indicate that the price may soon reverse or slow down. In sideways markets, these signals become more reliable because the price frequently moves between upper and lower boundaries of the range.
How to Use the Stochastic Oscillator in Sideways Markets
Traders mostly use the Stochastic Oscillator for identifying short-term reversals within a trading range. The following strategies explain how traders commonly use this indicator during sideways market conditions.
- Overbought and Oversold Trading
This is the most widely used stochastic strategy in range-bound markets. When the price reaches the upper or lower boundary of the range, the stochastic indicator moves into extreme zones. You can use the setups below:
Buy setup –
- If the price approaches the support level of the range.
- The stochastic indicator falls below the 20 level, which is an oversold zone.
- If the %K line crosses above the %D line, then traders can enter a buy position expecting the price to move back toward resistance.
Sell Setup –
- If the price approaches the resistance level.
- The stochastic indicator rises above the 80 level (overbought zone).
- When the %K line crosses below the %D line, traders can enter a sell position, expecting the price to decline toward support.
This strategy works well because sideways markets naturally create repeated price reversals.
- Stochastic Divergence
When the price movement and the stochastic indicator move in different directions, divergence occurs. This situation often signals a potential reversal.
Bullish Divergence –
If the price forms a lower low but the Stochastic forms a higher low, it is a sign of weakened selling momentum, even when the price is still declining. In sideways markets, this pattern often appears near support levels and may signal an upward price move.
Bearish Divergence –
A bearish divergence occurs when the price forms a higher high, but the Stochastic oscillator creates a lower high. This suggests weakening buying pressure and can signal a potential price decline near the resistance level.
- Midline Reversal Strategy
Many traders focus only on the 20 and 80 levels, but the 50 level can also provide useful signals in sideways markets. The midline often serves as a point of momentum balance.
A buy signal occurs when the Stochastic declines toward the 50 level, then turns upward again. It suggests that the buying momentum is retaining and prices may move upward again.
Opposite to the buy signal, a sell signal can occur when the Stochastic rises toward 50 and then reverses downward. This indicates weakening buying pressure and potential movement toward the lower boundary of the range.
Best Stochastic Settings for Sideways Markets
You can improve signal accuracy and reduce false signals by choosing the correct stochastic settings.
The most commonly used setting is 14, 3, 3, which provides a balanced combination of responsiveness and stability.
However, based on their trading style, traders can change the settings. Short-term traders frequently favour the faster setting 9, 3, 3 because it responds to price changes more quickly.
21, 5, 5 is a slower setting that produces smoother signals and is commonly used by swing traders who want to avoid excessive noise.
Conclusion
The stochastic oscillator works well in sideways or range-bound markets. It helps traders identify overbought and oversold conditions. Through which it signals potential price reversals within the trading range.
By combining stochastic signals with support and resistance levels, divergence patterns, and proper indicator settings, traders can improve the accuracy of their trades. Traders need to understand that the stochastic Oscillator should not be used in isolation. It should be combined with other tools like the top 20 trading indicators, including RSI, moving averages, or Bollinger Bands, for better confirmation.
Related News
-

Fadnavis dismisses national politics buzz, says his focus remains on Maharashtra
-
ED attaches hotel Rang Sharda and land worth Rs 332 Crore in Mumbai money laundering probe
-
Aamir Khan receives threat on Facebook, Mumbai Police verify claims
-
Bodies of 10 Tamil Nadu victims in Vietnam boat tragedy brought home