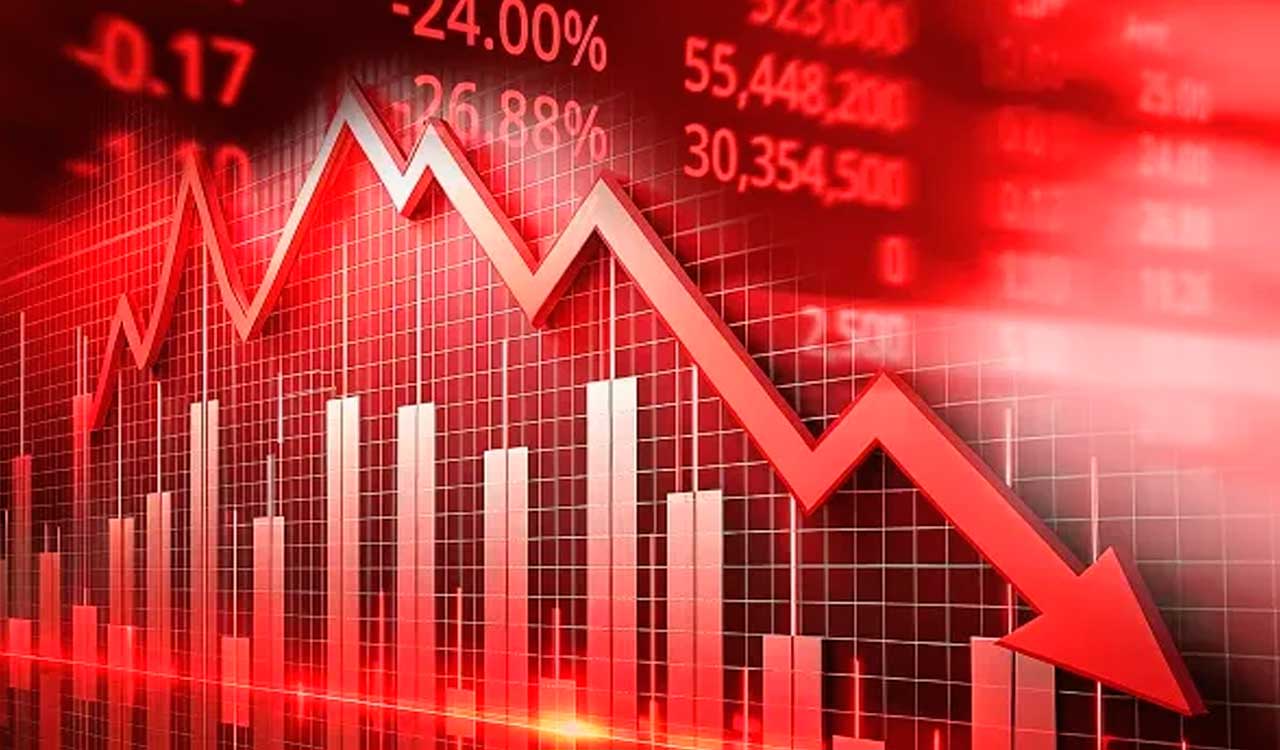
Does volatility have an impact on F&O trading?
Volatility in the stock market refers to the degree of variation in the price of underlying assets over time. It is a critical concept that significantly influences trading strategies, pricing, and market behaviour
New Delhi: Volatility in the stock market refers to the degree of variation in the price of underlying assets over time. It is a critical concept that significantly influences trading strategies, pricing, and market behaviour. When it comes to options and futures contracts, these are among the many financial instruments that are impacted by market volatility.
The impact of volatility on F&O trading
Implied Volatility and Options Pricing:
- Implied Volatility (IV): This is a critical factor in options pricing. As implied volatility increases, the prices of both call and put options generally rise. This is because higher volatility suggests a greater likelihood of the underlying asset moving significantly, increasing the chances that options will finish in-the-money.
- Historical Volatility: Historical volatility, which measures past price movements, also affects option pricing. Higher historical volatility often translates to higher option values, as it indicates a greater potential for future price movements.
- Market Response: When markets experience high volatility, traders often adjust their strategies. Increased trading volume in F&O can lead to more pronounced price swings, creating both opportunities for profit and risks of loss.
Volatility and Trading Volume:
- Increased volatility typically correlates with higher trading volumes in F&O markets. This is because traders seek to capitalize on price movements. However, while high volume can indicate liquidity, it can also lead to speculative trading that amplifies market volatility.
- The introduction of F&O trading has been shown to influence the underlying asset’s volatility differently across markets. Some studies suggest that while F&O trading does not necessarily destabilize the underlying market, it can change the nature of volatility observed.
Regulatory Measures:
Recent regulatory changes by the Securities and Exchange Board of India (SEBI) aim to mitigate excessive volatility associated with F&O trading. These include increasing contract sizes and limiting weekly expiries for index derivatives, which are intended to curb speculative behaviour and stabilize market conditions.
Risks Associated with Volatility
- Execution Risks: High volatility can lead to significant differences between expected and actual execution prices for F&O orders. This can result in increased costs and potential losses if trades are executed at unfavourable prices due to rapid market movements.
- Leverage Risks: F&O trading often involves leverage, which magnifies both potential gains and losses. In volatile markets, this can lead to substantial financial risks for traders who may not fully understand the implications of their positions.
How can traders and investors identify signs of volatility?
Investors can identify early signs of increasing volatility in Futures and Options (F&O) trading through various indicators and market signals. Here are some effective
methods:
1. Implied Volatility (IV):
- Monitoring IV Levels: Investors should track the implied volatility of options, which reflects market expectations of future price movements. A rising IV often indicates that traders anticipate greater price swings in the underlying asset, signaling potential increased volatility in the market.
- IV Rank and Percentile: By examining the IV rank (how current IV compares to historical levels) and percentile, investors can assess whether the current volatility is high or low relative to past performance. Extreme values may suggest a shift in market sentiment.
2. Trading Volume:
Volume Analysis: An increase in F&O trading volume can indicate heightened market activity and potential volatility. High volume during price movements often
correlates with increased volatility, as it suggests stronger investor sentiment—either bullish or bearish.
3. Historical Volatility (HV):
Calculating HV: Historical volatility measures past price fluctuations over a specific period. A significant increase in HV can signal that the market is experiencing larger
price swings, potentially leading to future volatility.
4. Technical Indicators:
- Bollinger Bands: These bands expand and contract based on market volatility. When the bands widen, it indicates increased volatility; conversely, when they contract, it suggests lower volatility.
- Average True Range (ATR): This indicator measures market volatility by calculating the average price range over a specified period. A rising ATR indicates increasing volatility and can help set stop-loss levels.
5. Market Sentiment and Economic Events:
- Monitoring News and Events: Significant economic announcements, earnings reports, or geopolitical events can trigger volatility spikes. Keeping abreast of such
events can help investors anticipate potential market reactions. - Investor Sentiment Indicators: Tools like the Fear & Greed Index can provide insights into overall market sentiment, which often correlates with volatility levels.
What measures can they take to safeguard their investments from volatility?
Investors can take several measures to protect themselves from increased volatility in stock market trading. Here are some key protective measures:
- Stay Informed on SEBI Regulations: The Securities and Exchange Board of Indiam(SEBI) has introduced new rules aimed at reducing speculative trading and
protecting retail investors. Familiarizing oneself with these regulations can help investors adjust their strategies accordingly. - Use Stop-Loss Orders: Implementing stop-loss orders can help limit potential losses during volatile market conditions. Setting predefined exit points allows investors to manage risk effectively.
- Diversification: Diversifying investments across different asset classes or sectors can reduce overall portfolio risk. This strategy helps mitigate the impact of volatility in any single asset or market segment.
- Focus on Hedging: Utilizing F&O instruments for hedging existing positions rather than speculative trading can provide a safety net against adverse price movements. This approach allows investors to protect their portfolios while still participating in the derivatives market.
- Keep an Eye on Volatility Indicators: Regularly track implied volatility (IV) and historical volatility (HV) metrics. Rising IV may indicate increasing market
expectations for price fluctuations, prompting a reassessment of trading positions. - Volume Analysis: High trading volumes often accompany increased volatility. Monitoring trading volumes can provide insights into market sentiment and potential price movements.
- Adjust Trading Frequency: With new regulations likely reducing the frequency of expiries, investors may need to adapt their trading strategies to focus on longer-term positions rather than short-term speculative trades.
Conclusion
Volatility plays a crucial role in F&O trading by affecting option pricing, influencing market dynamics, and introducing various risks. By utilizing the above-mentioned indicators and measures to safeguard their investments, investors can better navigate the stock market and make sure their investments align with their objectives.