How to Read Stock Market Signals: What Sensex and Nifty Moves Actually Mean
Learn how to read Sensex and Nifty signals to make smarter trade decisions in India’s volatile 2026 stock market.
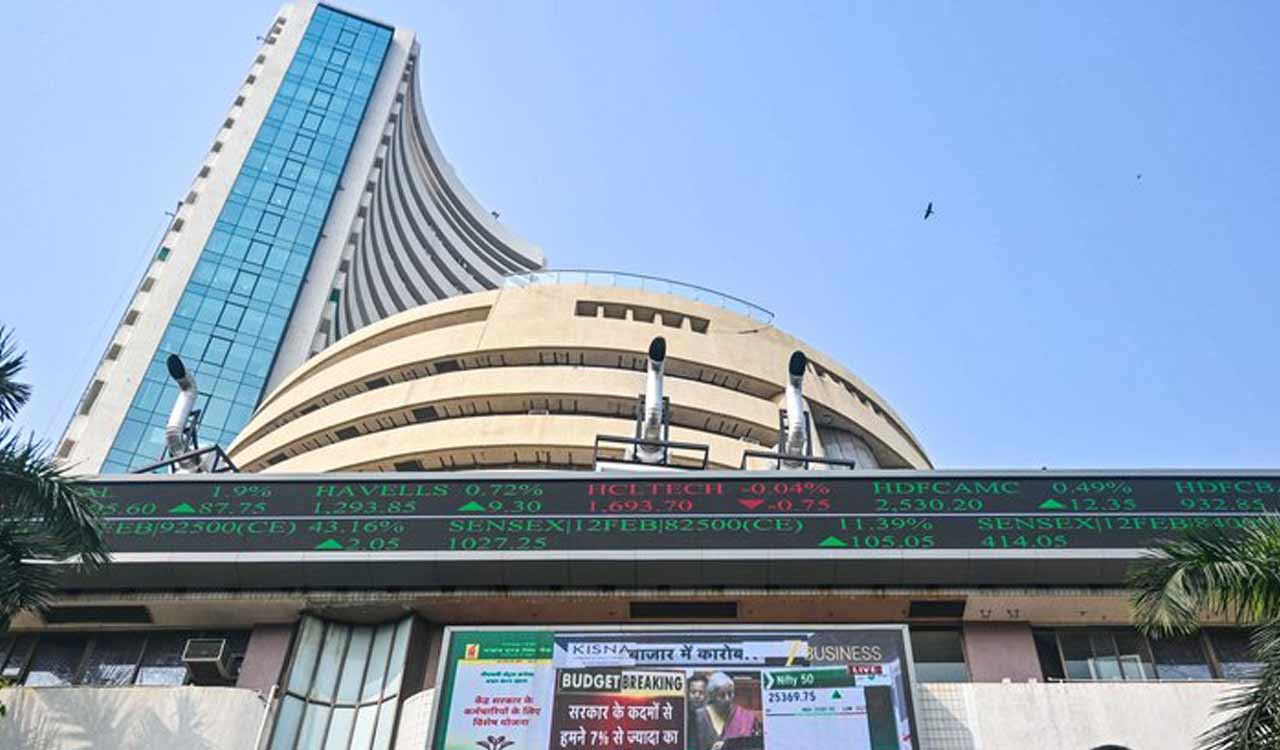
Every trading day, two numbers dominate Indian financial headlines – the Sensex and the Nifty. One (SENSEX) tracks 30 blue-chip companies on the Bombay Stock Exchange; the other (NIFTY) follows 50 large caps on the NSE. Together, they act as the nation’s economic pulse.
But knowing that they moved is very different from understanding why and what you should do next.
Most traders fixate on price alone. The ones who consistently make better decisions learn to read Nifty signals and Sensex cues in combination – layering flow data, volatility readings, and derivatives activity into a coherent picture before placing a trade.
Here’s a simple guide to the Sensex and Nifty signals that actually matter.
Key Takeaways
- FII selling countered by DII buying creates a market “tug-of-war” that prevents a total crash, often keeping prices stable. While this usually makes buying small price drops a smart move, recent negative performance has made this strategy dangerous.
- India VIX above 19 demands smaller position sizes and tighter stops as elevated fear increases the probability of sudden gap moves in either direction.
- OI data at key Nifty levels acts as a real-time roadmap, showing where institutional hedges are concentrated and where price is likely to stall or accelerate.
The Indices
The Sensex tracks the performance of 30 large, financially strong companies listed on the BSE, reflecting overall market sentiment, economic health, and investor confidence in India. Nifty 50 performs a similar role on the NSE, offering a broader, 50-stock snapshot of the economy.
When either index rises or falls sharply, the movement rarely happens in isolation. It is almost always the product of several overlapping signals firing simultaneously, and reading those signals is where the edge lies.
Signal 1: FII vs DII Flows
Foreign Institutional Investors (FIIs) and Domestic Institutional Investors (DIIs) are the two heaviest hands in the Indian market. FIIs (holding approximately 16.7% of active equity market capitalisation) represent global capital from entities like hedge funds and mutual funds, while DIIs (holding about 18.7% of all NSE-listed equities) comprise local powerhouses such as Indian banks and insurance providers.
When FIIs sell, as they have done persistently through early 2026 amid US Federal Reserve rate anxieties, indices tend to weaken sharply, particularly in export-linked sectors such as IT.
DIIs, largely made up of mutual funds and insurance companies, frequently step in as FIIs exit, cushioning the fall.
Watching the net FII vs DII flow data each day tells you who is controlling the narrative. Sustained FII outflows alongside DII buying often signals a tug-of-war market – volatile, but with support beneath it.
Signal 2: India VIX
India VIX measures expected volatility in the Nifty over the near term.
Think of it as the market’s anxiety thermometer. When VIX climbs above 20, traders are pricing in significant uncertainty – expect wider swings, gap-down openings, and erratic intraday moves. When it drops below 15, calm has returned and trending strategies begin to work better.
In mid-March 2026, VIX has been hovering approximately in the 18-24 zone – elevated enough to demand caution. A sudden spike in VIX warrants tightening stop-losses, regardless of what the price chart says.
Signal 3: Sector Rotation
Markets usually do not fall or rise uniformly.
Sector rotation is the process of institutional money shifting from one sector to another in response to macro conditions. In February and March 2026, before the Iran war uncertainty, capital goods, auto, and real estate initially saw some buying interest—sectors tied to domestic economic activity.
Meanwhile, IT and FMCG lagged, reflecting overseas revenue concerns and sluggish consumption data respectively.
When defensives attract buying, it signals caution. When cyclicals lead, it suggests underlying confidence in growth. Tracking which sectors are gaining on heavy volume versus which are fading quietly is often more informative than watching the headline index.
Signal 4: OI Data
Open Interest data from the F&O (Futures and Options) market reveals where significant positions are being built or unwound. A rise in OI alongside a price increase confirms bullish momentum. A rise in OI with falling prices signals fresh short-building – bearish pressure ahead.
As far as April 2026 is concerned, until Nifty decisively reclaims 23,300, the near-term bias remains cautious to bearish.
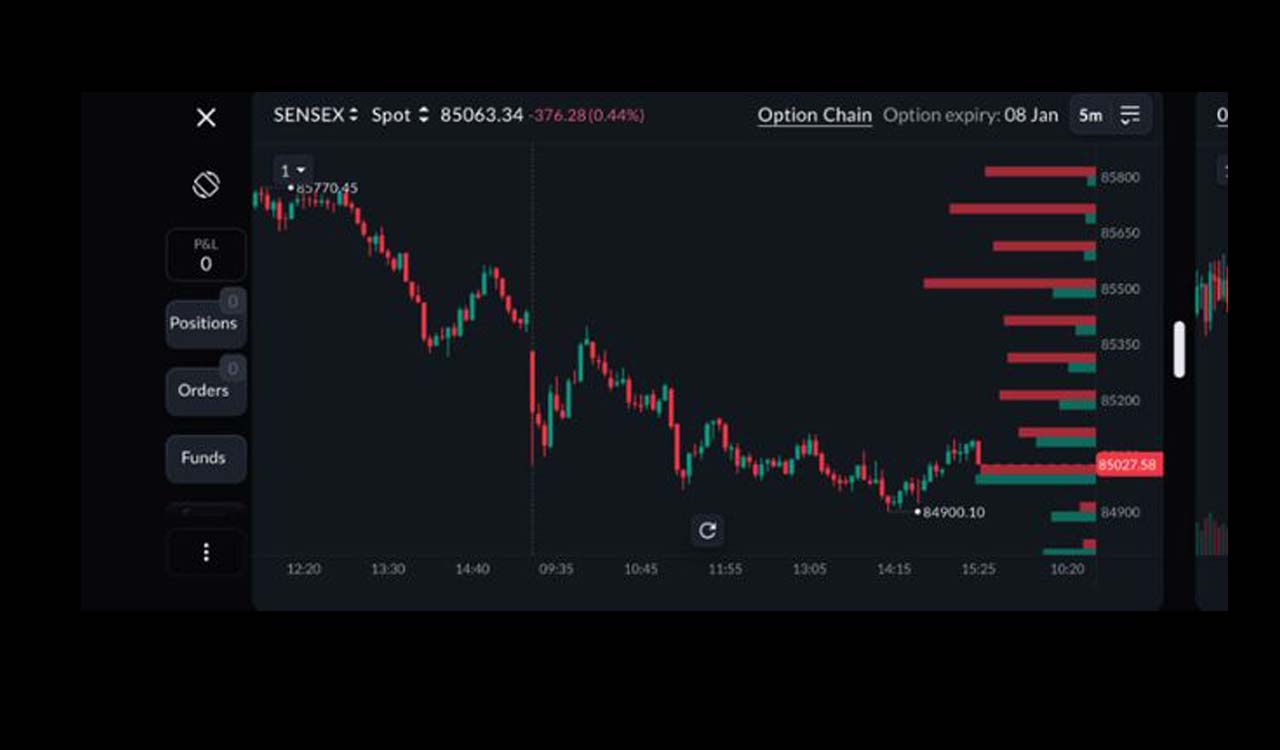
Traders using Sahi can see real-time OI shifts and FII activity reflected in price action directly on their charts connecting the macro signal to an actual trade decision in the same view.
Image caption: Sahi’s OI profile
How to Read the Daily Moves
| Signal | Market Mood | What It Tells You | Simple Meaning |
| Gap-up opening + fading volume | Tired/ exhausted | Likely profit-booking; wait before entering | The market opened high but lacks “fuel”; expect prices to drop as traders take profits. |
| High volume + range breakout | Strong | Conviction move; trend likely to follow through | Big players are buying with high confidence; a strong upward trend is starting. |
| VIX spike + FII selling | Fearful | Reduce position size; protect capital | Fear is rising and foreign money is leaving; stay safe and reduce your risk. |
| DII buying + sectoral breadth | Supportive/ stable | Dip may be buyable; watch for confirmation | Local funds are buying across many stocks; the market foundation is healthy and strong. |
| OI build at resistance | Capped/ blocked | Smart money expects capping; consider hedging longs | Traders are betting the price won’t rise further; expect a ceiling on gains. |
The Bottomline
The broader trend of the stock market remains cautious, shaped by global headwinds. Until then, buy-on-dips with defined risk is the prudent posture.
Reading the market well is not about prediction and rather involves stacking multiple Nifty signals and Sensex cues until the weight of evidence tips clearly in one direction. That discipline, applied consistently, is what separates reactive trading from informed decision-making.
FAQs
- What does FII selling mean for retail investors?
Sustained FII selling often creates short-term price pressure. However, if DIIs are absorbing the selling, the downside can be limited. It is rarely a signal to panic-sell but as of now, sustained FII selling combined with a VIX above 20 is a signal to stop “buying every dip” and wait for the dust to settle.
- What is a safe India VIX level for positional trading?
Most traders prefer initiating positional trades when VIX is below 15-16. Above 20 typically calls for shorter time frames and tighter risk management.
- How do I use OI data practically?
Focus on where the highest call and put OI is clustered each week. Those strikes represent resistance and support respectively, and price tends to gravitate towards or react strongly at those levels.