Rewind: The SIR Shake-up—how electoral rolls changed across States
A closer look at how electoral roll revisions have changed the numbers of male and female voters across Bihar, Kerala, Tamil Nadu and West Bengal


By Dr Neeraj Kumar, Dr Maya K
The revision of electoral rolls ahead of the Assembly elections in Bihar, Kerala, Tamil Nadu, and West Bengal raised concerns among voters and political parties about the addition and deletion of names.
Also Read
Figure 1: Male and female elector trends
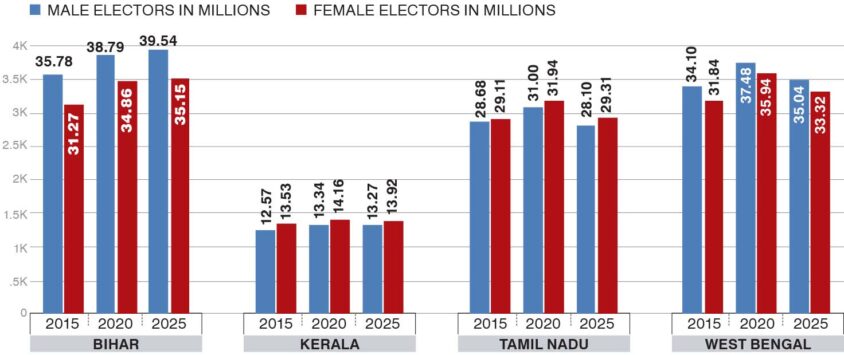
Note: Data on male and female electors were obtained from the Election Commission of India.
Figure 1 shows that Bihar recorded a continued increase in both male and female electors across the three elections. Kerala, Tamil Nadu and West Bengal, however, recorded a decline in both groups in the latest election compared with the previous one. The fall was relatively small in Kerala but much higher in Tamil Nadu and West Bengal.
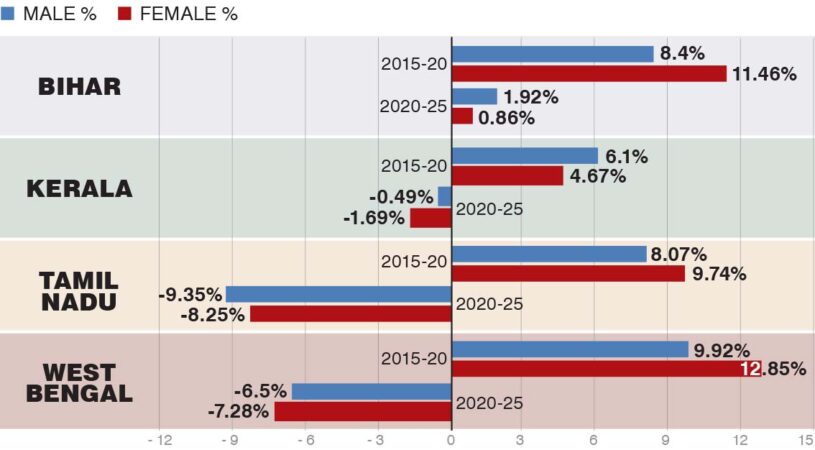
Table 1: Percentage change in male and female electors
Note: Data obtained from the Election Commission of India. Percentage change was calculated by comparing the number of male and female electors between two successive Assembly elections. Calculations are by the authors.
Table 1 confirms that the growth of the electorate slowed considerably in Bihar. Male voters increased by 8.4% and female by 11.46% between 2015 and 2020. Between 2020 and 2025, however, after SIR, the corresponding increases fell to 1.92% and 0.86%, respectively. Thus, women grew faster during the first period but much more slowly than men during the latter period.
In Kerala, male electors increased by 6.1% and female electors by 4.67% between 2016 and 2021. Between 2021 and 2026, male electors declined by 0.49%, while women declined by 1.69%. The decline among women was, therefore, more than three times that among men.
Tamil Nadu recorded growth of 8.07% among men and 9.74% among women between 2016 and 2021. This was followed by a decline of 9.35% among men and 8.25% among women. Although both groups declined sharply, the fall was greater among men.
In West Bengal, female electors increased faster than male electors between 2016 and 2021. However, between 2021 and 2026, the number of female electors declined by 7.28%, compared with a 6.5% decline among men.
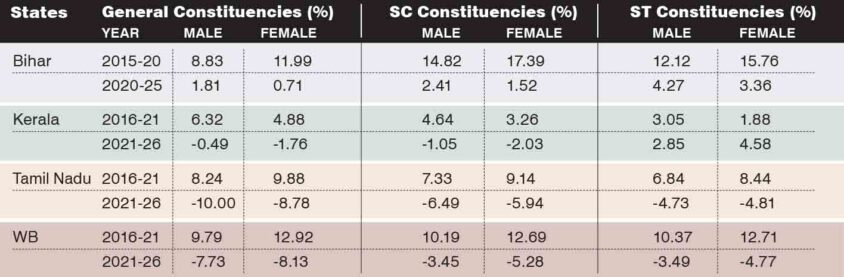
Table 2: Changes across General, SC and ST constituencies
Note: Data obtained from the Election Commission of India. Constituency-wise percentage changes were calculated separately for General, SC and ST constituencies and for male and female electors. Calculations are by the authors. Bihar has 203 General, 38 SC, and 2 ST constituencies; Kerala has 124 General, 14 SC, and 2 ST constituencies; Tamil Nadu has 188 General, 44 SC, and 2 ST constituencies; West Bengal has 210 General, 68 SC, and 16 ST constituencies throughout the study years.
The constituency-wise figures in Table 2 show that gender patterns were not uniform across categories. In Bihar, both male and female electors increased in General, SC and ST constituencies during both periods.
Women recorded faster growth than men between 2015 and 2020. In the latest period, however, male electors grew faster in all three categories. The relative slowdown among women was particularly visible in General constituencies, where their number increased by only 0.71%, compared with a 1.81% increase in male voters.
In Kerala, both men and women declined in the General and SC constituencies between 2021 and 2026. But women’s data showed a greater decline in both categories. However, ST constituencies’ data showed the opposite pattern: male electors increased by 2.85%, while female electors increased by 4.58%.
In Tamil Nadu, both male and female electors declined in all three constituencies between 2021 and 2026. The decline was relatively higher in the general constituencies. Men declined more than women in General and SC constituencies, while the decline among women was marginally higher in ST constituencies.
In West Bengal, both groups declined across all three constituency categories between 2021 and 2026. In General constituencies, the declines among men and women were broadly similar. In SC and ST constituencies, however, the decline among women was considerably higher than the decline among men.
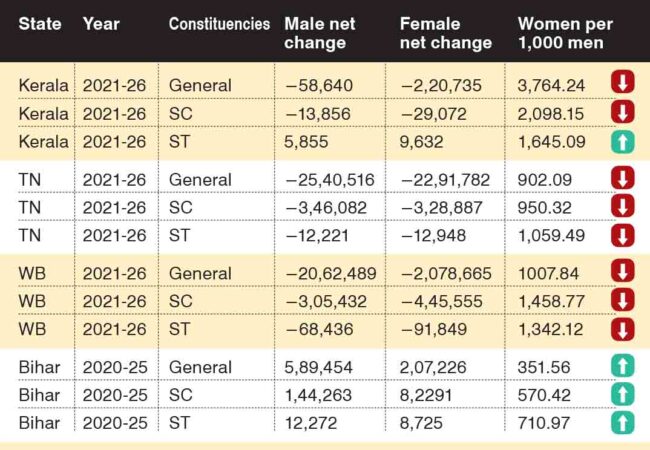
Table 3: Women electors changed per 1,000 men electors
Note: Data were obtained from the Election Commission of India. Net change was calculated as the number of electors in the latest election minus the number in the previous election. Women electors changed per 1,000 men electors was calculated using the absolute change in women divided by the absolute change in men, multiplied by 1,000. Calculations are by the authors.
Table 3 shows the net change in the gender composition in each constituency category. In Kerala’s General constituencies, the number of women electors declined by 3,764 per 1,000 men, thereby reducing the roll. In SC constituencies, the corresponding figure was 2,098 women. ST constituencies recorded an increase instead of a decline, with 1,645 women added for every 1,000 additional men.
In Tamil Nadu, the decline was relatively balanced between men and women. For every 1,000 men by which the electoral roll declined, the decline among women was 902 in General constituencies, 950 in SC constituencies, and 1,059 in ST constituencies.
In West Bengal, women accounted for a greater decline in all three categories. For every 1,000 male voters deleted, 1,008 female voters were deleted in General constituencies, 1,459 in SC constituencies and 1,342 in ST constituencies. The gender imbalance in the deletion was, therefore, most pronounced in SC constituencies.
Bihar recorded an increase rather than a decline, but gender differences were present in all three categories of constituencies. For every 1,000 additional male voters, the number of women increased by only 352 in General constituencies, 570 in SC constituencies and 711 in ST constituencies, showing a strong male-driven electorate expansion in Bihar.
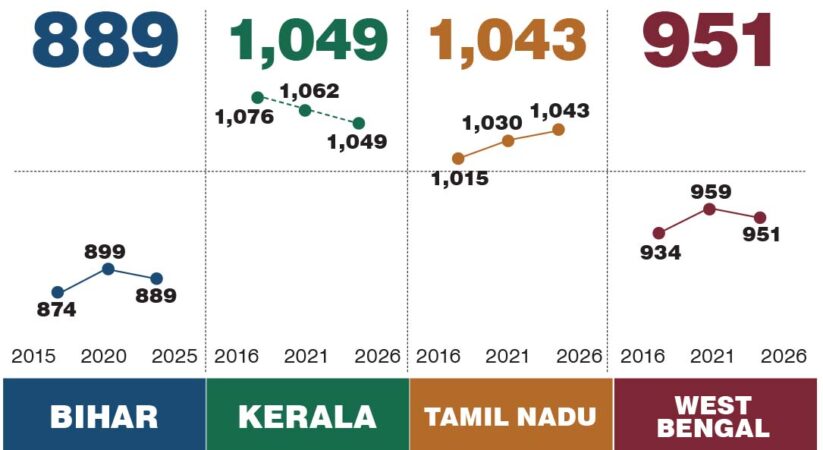
Table 4: Overall electoral gender ratio
Note: Data were obtained from the Election Commission of India. The electoral gender ratio represents the number of women electors per 1,000 men electors. Calculations are by the authors.
Table 4 shows the gender ratio, which represents the number of female electors per 1,000 male electors. Bihar’s gender ratio improved from 874 in 2015 to 899 in 2020, but it decreased to 889 female voters for 1000 male voters in 2025. Women, therefore, remained substantially under-represented relative to men.
Kerala continued to have more women electors than men. However, its gender ratio steadily declined from 1,076 in 2016 to 1,049 in 2026, indicating that the female advantage narrowed over time.
Tamil Nadu recorded a continuous improvement in its gender ratio. Its gender ratio rose from 1,015 women per 1,000 men in 2016 to 1,043 in 2026. Women increasingly outnumbered men despite the recent fall in the total electorate.
West Bengal’s gender ratio increased from 934 in 2016 to 959 in 2021 but declined marginally to 951 in 2026. Although the latest year’s gender balance was weaker than in 2021, it remained better than in 2016.
To summarise, the data analysed here reveal clear differences in the experiences of male and female electors. Bihar continued to add electors, but the latest increase was driven more by men. Kerala’s recent decline was considerably greater among women, although its ST constituencies recorded growth in both groups.
Tamil Nadu experienced a large decline among both men and women, but its gender ratio continued to improve because the decline among male voters was larger. West Bengal recorded a greater decline among women, particularly in SC and ST constituencies. Even though the SIR resulted in changes in the electoral roll, the large differences in voter numbers should be properly addressed.
The changes in the number of electors after SIR, compared with previous elections, may be due to several factors, not only population change. Rapid urbanisation, migration for education and employment, people shifting from one place to another, deaths, and the addition of new voters can all affect the number of electors.
Some people may also register in a new constituency after moving, while their names may remain on the previous electoral roll. This can lead to duplicate or incorrect entries, which may be identified and removed during the SIR process.
The recently concluded State elections in Kerala, Tamil Nadu, and West Bengal recorded high voter turnout. Experts attribute this partly to the identification and removal of “ghost electors”—dead, shifted, absent, or duplicate entries.
(The authors are Assistant Professors, Department of Economics, Christ University, Bengaluru)

Related News