Opinion: What India eats, and how
Proper sampling methodology for Household Consumption Expenditure Survey will ensure better representation
By Dr Vaishnavi Sharma, Dr Kedar Vishnu
The much-awaited Household Consumption Expenditure Survey (HCES) 2022-23 data has come after a gap of over ten years. The National Sample Survey Organization (NSSO) started with the collection of household expenditure yearly data from the 1st round (1950-51) to the 28th round (1973-74). However, it started collecting five-year data on large-scale and the report results were published from the 27th round (1972-73) onwards. As a result, HCES data started entering public domain every five years, from the 1972-73 round onwards.
Also Read
The last such data before the latest one was for 2011-12. It was further decided to have two rounds of surveys in 2020-21 and 2021-22 to see what would serve as a better period for the revision of the base year for macroeconomic indicators, but due to Covid-19, these could not be conducted. It was only in August 2022 that this survey could start, post the pandemic, and continued until July 2023, the data for which was made public in February this year.
The information derived from these surveys is useful in determining and deriving macroeconomic indicators. Further, it helps us understand the status of the poverty level and consumer price index (CPI) inflation besides understanding the dynamics of change in the consumption pattern in rural and urban areas.
Then and Now
However, the data from the current survey is different from that of the previous surveys. The primary reason is the various changes in the methodology. First, the items covered in the new questionnaire (HCES 2022-23) aren’t exactly the same as those of CES 2011-12. A few obsolete items have been removed from the list, and some have been added. The new list in the questionnaire comprises 405 items against the earlier list, which consisted of 347 items.
Second, the earlier surveys were conducted in a single visit, but three monthly visits were scheduled for the 2022-23 HCES survey. In addition, the NSSO has used the digital app to collect data, which was not done earlier. Third, HCES 2022-23 considers the imputed cost of a few non-food items that the households received through social welfare schemes (like computers, bicycles, laptops). For the earlier surveys, this wasn’t considered.
Lastly, there has been a significant change in the sampling strategy. Households are categorised into three groups based on two criteria: possession of land in rural and possession of cars in urban. In a country where only a small fraction of the vast population owns a car and where the agricultural farm workers are not the owners, the sample selection is biased towards the better-off sections of society. Hence, the HCES 2022-23 data cannot be called a true representative (sample) of the consumption pattern of the country as a whole.
Key Findings
In HCES 2022-23, rural households’ monthly per-capita consumption expenditure (MPCE) increased by 162% to Rs 3,773 from Rs 1,440 in the 2011-12 round. Similarly, urban expenditure climbed by 146% during the same period, from Rs 2,630 to Rs 6,459. Moreover, the MPCE gap between rural and urban areas has shrunk, falling from 83.9% in 2011-12 to 71.2% in 2022-2023. In addition, the percentage of food in the total MPCE has decreased from 46% in 2011-12 to 39% in 2022-23. Conversely, the share of non-food items has increased from 54% to 61%. It must be noted that the share of food expenditures is declining in both rural and urban areas.
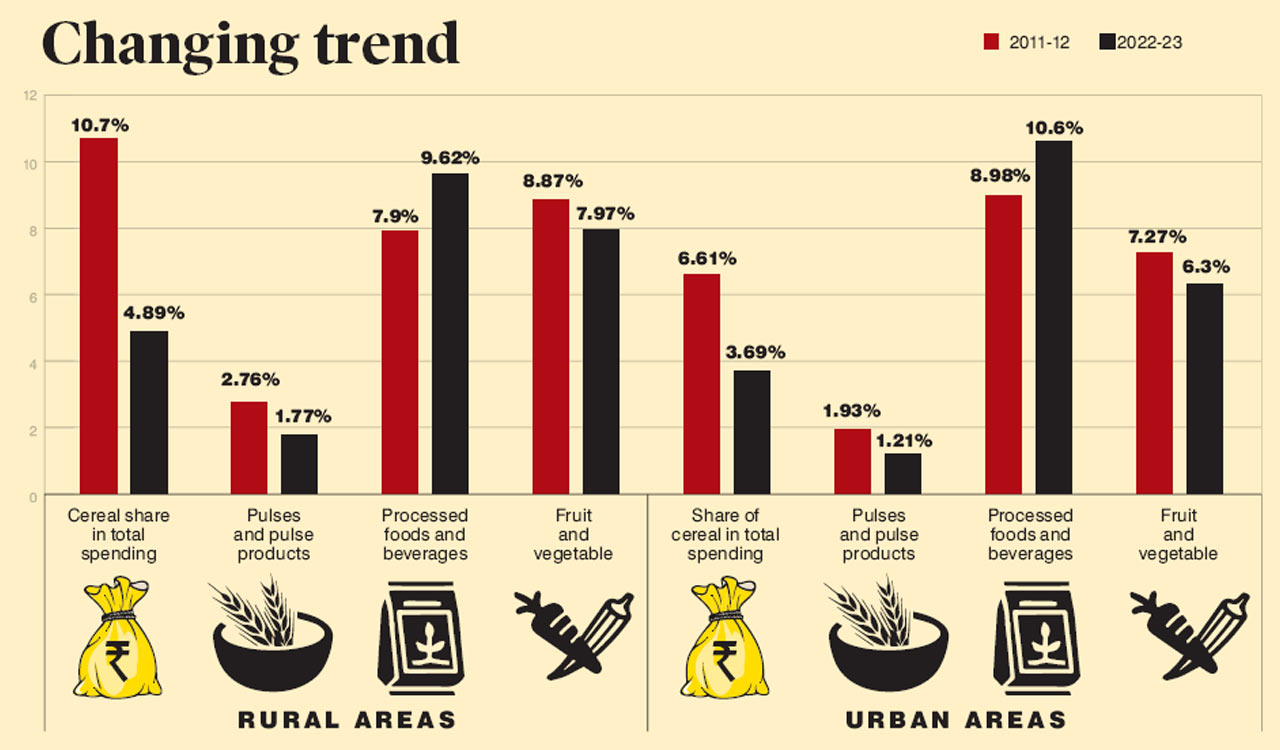
The data also indicates that rural consumption spending has increased significantly over the years. Compared with the previous cycle, we discovered that in rural areas, the share of cereal in total spending has declined from 10.7% in 2011-12 to 4.89% in 2022–2023. Likewise, pulses and pulse products share has declined from 2.76 to 1.77 %. However, the share of processed foods and beverages has increased from 7.9% to 9.62%.
Similar findings have also been noted for urban areas, where the percentage of beverages and processed foods increased to 10.6% in 2022-23 from 8.98% in 2011-12. Fruit and vegetable share has surprisingly decreased from 8.87% to 7.97% in rural areas and 7.27% to 6.3% in urban areas. The effect of the spike in processed foods share is that the share of sugar and salt has decreased, both for urban and rural households. This is probably because processed foods and beverages are already salt- and sugar-rich.
Evolving Preferences
The overarching trend in the food composition of the MPCE indicates a decline in the nutritional value of household food intake over time. Furthermore, a closer examination of non-food items reveals a notable surge in durable goods consumption among rural and urban households. This uptick suggests increased purchasing power within households, highlighting evolving consumer preferences and economic dynamics.
To sum up, despite methodological changes and sampling challenges, the HCES 2022-23 offers a glimpse into the evolving socio-economic landscape of the country and provides us valuable insights into consumption patterns and economic dynamics, shedding light on the latest rural and urban consumption behaviours.
In light of these insights, there are two notable points worth consideration. First, there is a pressing need to employ a proper sampling methodology to ensure better representation across socio-economic strata, focusing on inclusive stratification. Second, there is an urgent need to raise awareness regarding sustainable consumption practices and promote nutritional awareness and food security among households, specifically in rural areas. The findings can help policymakers formulate strategies for promoting inclusive growth and addressing socio-economic challenges.
(Dr Vaishnavi Sharma is an Economist with a PhD from Indira Gandhi Institute of Development Research (IGIDR), Mumbai. Dr Kedar Vishnu is an Assistant Professor of Economics at Narsee Monjee Institute of Management Studies, Mumbai)