Rewind: Telangana’s Economy – from growth to policy uncertainty
Telangana’s decade-long high-growth model kept the economic cycle dynamic—wages, welfare and investment drove circulation. Today, policy shifts and reduced household cash flow are slowing the cycle, weakening demand, rural incomes and employment
By Pendyala Mangala Devi
Before the formation of Telangana, a fundamental question was repeatedly raised: Could this State sustain itself economically? A decade of governance answered that question through data and outcomes.
Also Read
From Rs 4.51 lakh crore in 2013–14, Telangana’s GSDP rose to Rs 14.63 lakh crore by 2023–24, registering an average annual growth rate of about 22.4 per cent. Per capita income increased from Rs 0.95 lakh to Rs 3.47 lakh, achieving an average annual growth of around 26.4 per cent. These are not merely numbers but indicators of a structural transformation driven by a deliberate economic model.
Development is about expanding the real freedoms that people enjoy — Amartya Sen
The Multiplier Effect: The Journey of One Rupee
The foundation of this growth lies in a simple macroeconomic principle. Government spending expands the economy through consumption. This is captured through the concepts of Marginal Propensity to Consume (MPC) and the multiplier effect.
MPC=ΔC/ΔY
MPC measures how much of the additional income is spent. For example, if a person spends Rs 80 out of an additional Rs 100, the MPC is 0.8.
Income increases lead to consumption increases — John Maynard Keynes
Multiplier=1/(1-MPC)
Based on MPC, the multiplier effect determines how spending expands across the economy. In practical conditions, due to leakages such as taxes, savings, and imports, the multiplier ranges between 1.5 and 2.5. This means that every Rs 100 spent by the government can generate between Rs 150 and Rs 250 of economic value.
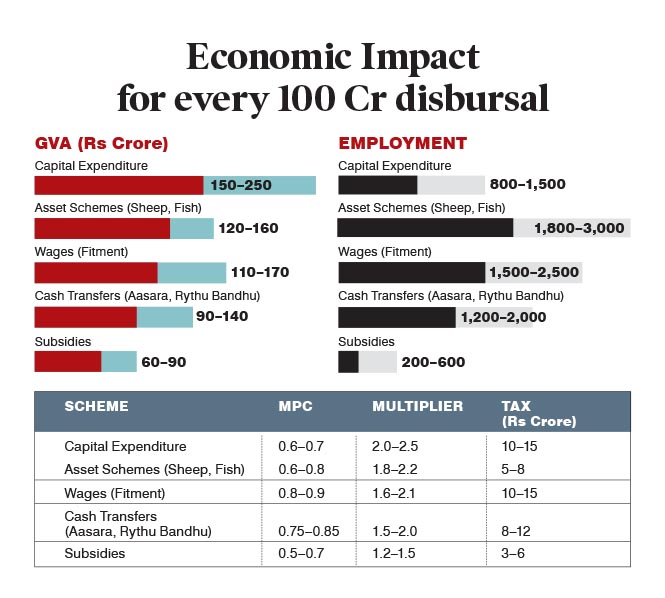
Differential Impact of Schemes on Growth
Different schemes produce different multiplier effects. Aasara pensions, increased from Rs 200 to Rs 1,000 and later to Rs 2,000, directly target low-income households where MPC is high, typically between 0.85 and 0.95. This results in a multiplier between 1.8 and 2.3, rapidly boosting rural consumption.
Rythu Bandhu, increased from Rs 4,000 per acre to Rs 5,000 per acre, ensures liquidity in farmers’ hands, with MPC between 0.75 and 0.85 and a multiplier between 1.5 and 2.0, thereby sustaining rural markets.
Asset schemes such as sheep distribution and fisheries not only support consumption but also create income-generating assets. While MPC here ranges from 0.6 to 0.8, the multiplier rises to 1.8-2.2 due to sustained income generation.
The 73 per cent wage fitment for government employees ensured a steady flow of income into the economy, with MPC between 0.8 and 0.9 and multiplier between 1.6 and 2.1, creating stable monthly demand.
Subsidies typically have a lower MPC between 0.5 and 0.7 and multiplier between 1.2 and 1.5. Capital expenditure, though indirect, has the highest long-term impact, with multiplier between 2.0 and 2.5 due to its effect on infrastructure and investment.
In essence, when money reaches high MPC groups, it quickly enters consumption and creates a chain reaction of income, production, employment, and taxes. Income leads to consumption, consumption leads to production, production leads to employment, and employment leads to tax revenues.
Rural Economy: A Dual Engine of Demand and Production
This model was particularly visible in the rural economy. Aasara pensions, Rythu Bandhu, livestock schemes, and fisheries together created a dual engine of demand and production.
Direct transfers to rural households stimulate both demand and local production — IMF
Wages as a Stable Demand Engine
The wage policy further strengthened this system. The 73 per cent fitment was not merely welfare but a structural demand engine that ensured continuous liquidity in the economy.
Impact of Public Spending on the Economy
The impact of different types of spending clearly shows how the economy responds. Capital expenditure generates the highest long-term growth. Asset schemes create maximum employment. Wages provide stable, recurring demand. Cash transfers ensure fast circulation. Subsidies provide protection but with a lower multiplier impact.
The KCR Model: A High Multiplier Ecosystem
This integrated approach formed what can be called a high multiplier ecosystem. Capital expenditure drove growth, cash transfers created demand, asset schemes generated employment, and wages ensured stable consumption.
In the long run, investment drives productivity and growth — World Bank
Present Scenario: Policy Shift and Its Economic Impact
However, the present situation indicates a significant shift in policy direction. Over the last two-and-a-half years, there has been no meaningful increase in money reaching people.
There has been no increase in Aasara pensions. There has been no wage revision for government employees. Cash transfer schemes such as Rythu Bandhu have been disrupted. Asset creation programmes like sheep distribution and fisheries have not been continued.
This has resulted in a sharp decline in the flow of money into the economy. At the same time, the absence of asset schemes like sheep and fish seed distribution has reduced income generation opportunities in rural areas.
Breaking the Economic Cycle
The outcome is a visible decline in demand across markets. Small businesses are under stress. The service sector is slowing. Daily wage workers are facing reduced employment opportunities.
This is not a theoretical concern but a clear macroeconomic chain reaction. When incomes fall, consumption declines. When consumption declines, production slows. When production slows, employment reduces. When employment reduces, tax revenues fall.
When demand weakens, growth inevitably slows. –OECD
Growth Trends: Stability or Slowdown
Recent growth figures reflect this slowdown. GSDP growth stands at around 10.7 per cent and per capita income growth around 10.5 per cent. While these numbers appear stable, they represent a clear deceleration compared to the previous decade.
Revenue Trends: Signals of Economic Stress
Revenue data further confirms this trend. Revenue receipts increased from Rs 51,041 crore in 2014–15 to Rs 1,69,293 crore in 2023–24, working out to about 23 per cent average annual growth. However, in 2024–25, revenue receipts declined to Rs 1,67,804 crore, a reduction of Rs 1,489 crore or negative growth of 1 per cent.
State Own Tax Revenue shows a similar pattern. It increased from Rs 29,288 crore in 2014–15 to Rs 1,11,798 crore in 2023–24, working out to about 31.3 per cent average annual growth. But in 2024–25, it declined to Rs 1,09,233 crore, a drop of Rs 2,565 crore or negative growth of 2.3 per cent.
The question that arises is whether turning positive growth into negative growth can be considered progress or regression.
Widening Impact Across Society
The broader consequences are now visible across society. Farmers are facing uncertainty. Employees are experiencing income stagnation. Small traders are seeing reduced demand. Workers are facing declining employment opportunities. Dissatisfaction is rising across all sections.
From a Vibrant Cycle to a Slowing Economy
Earlier, the economic cycle functioned dynamically. Wages, welfare schemes, and investments ensured that every rupee circulated multiple times in the market. Today, that cycle has slowed.
When people do not have money in their hands, consumption declines. When consumption declines, businesses contract. When businesses contract, employment reduces. This chain reaction inevitably reduces government revenues. The result is clear and visible.
Need to Restore Economic Circulation
Consumption is the sole end and purpose of all production. — Adam Smith
But without income, there is no consumption. Without consumption, there is no growth. When pensions are not increased, wages are not revised, and income support schemes are disrupted, the circulation of money itself declines. Without asset creation, rural incomes weaken. Without decisions that sustain the economic cycle, even welfare cannot remain stable.
If money does not flow into people’s hands and circulate through the economy, growth not only slows but public confidence is also undermined.
The lesson is clear. Economic strength does not depend merely on how much is spent, but on how effectively money circulates through the system. When that circulation weakens, the very foundation of growth begins to erode.