Opinion: Mirage of poverty reduction
Despite economic slowdown and the Covid pandemic, a steep reduction in poverty raises several doubts
By P Devendra
Starting from Dadabhai Naoroji’s ‘Poverty and Unbritish Rule in India’ during pre-independence, poverty estimations have been crucial in understanding deprivation and framing poverty eradication policies.
Also Read
Recently, two important reports on poverty reduction were released: the Global Multidimensional Poverty Index (MPI) by Oxford Poverty and Human Development Initiative with United Nations Development Programme and the National Multidimensional Poverty Index by NITI Aayog. Both claim significant poverty reduction in India. However, as one of the fastest-growing economies, India must carefully evaluate growth conditions, inequality, and poverty to chart the path for Atmanirbhar Bharat.
Despite the precipitous negative gross domestic product (GDP) growth rate (-6.6%) in 2020-21, India’s growth story in the 21st century continues to be optimistic. The latest Budget estimates put India’s GDP growth rate at 7.2% for 2022-23 and 9.1% for 2021-22. Even before this period, India’s growth in wealth creation in terms of GDP has been prosperous in the last two decades.
Regardless of shocks and absorptions, this emerging growth is cited as the major driver behind India’s success in uplifting more than 400 million people from the shackles of poverty. Hence, the growth during this period is eulogised as ‘pro-poor’. The poverty estimates from international and domestic reports corroborate this notion but raise several doubts and dissents.
Non-Inclusive
The concepts of growth and poverty are used to characterise a nation’s economic status and overall welfare. In contrast, inequality serves as a measure of the extent and scope of wealth distribution. The Gini coefficient, a widely employed measurement for assessing income disparities among individuals, indicates a pronounced rise in inequality in India during periods of robust economic growth and declining poverty rates.
As per the Credit Suisse Global Wealth Report 2022, India’s Gini coefficient has steadily increased from 74.7 in 2000 to 82.3 in 2021. In fact, India’s Gini coefficient was the second highest, after Saudi Arabia (86.4), among fast-growing economies. Oxfam International study shows a rapid increase in billionaires in India from 9 in 2000 to 101 in 2017. Between 2018 and 2022, it was estimated that India would produce 70 new millionaires daily. In 2019, 73% of the wealth created went to the richest 1%, while 67 crore people saw only a 1% increase in wealth.
This statistical data substantiates the assertion that the growth trajectory aimed at reducing poverty, commonly referred to as ‘pro-poor’ growth, is not equitably distributed across the populace. Consequently, widening income and wealth inequalities impede the achievement of inclusive development.
Debates and Dissents
The Global MPI report shows that India uplifted 41.5 crore people from multidimensional poverty between 2005-06 and 2019-21, reducing overall poverty from 55.1% to 16.4%. The National MPI report by NITI Aayog claims a reduction from 24.85% in 2015-16 to 9.89% in 2019-21.
Multidimensional Poverty measures the percentage of households in a country deprived along three dimensions –monetary poverty, education, and basic infrastructure services, according to the World Bank.
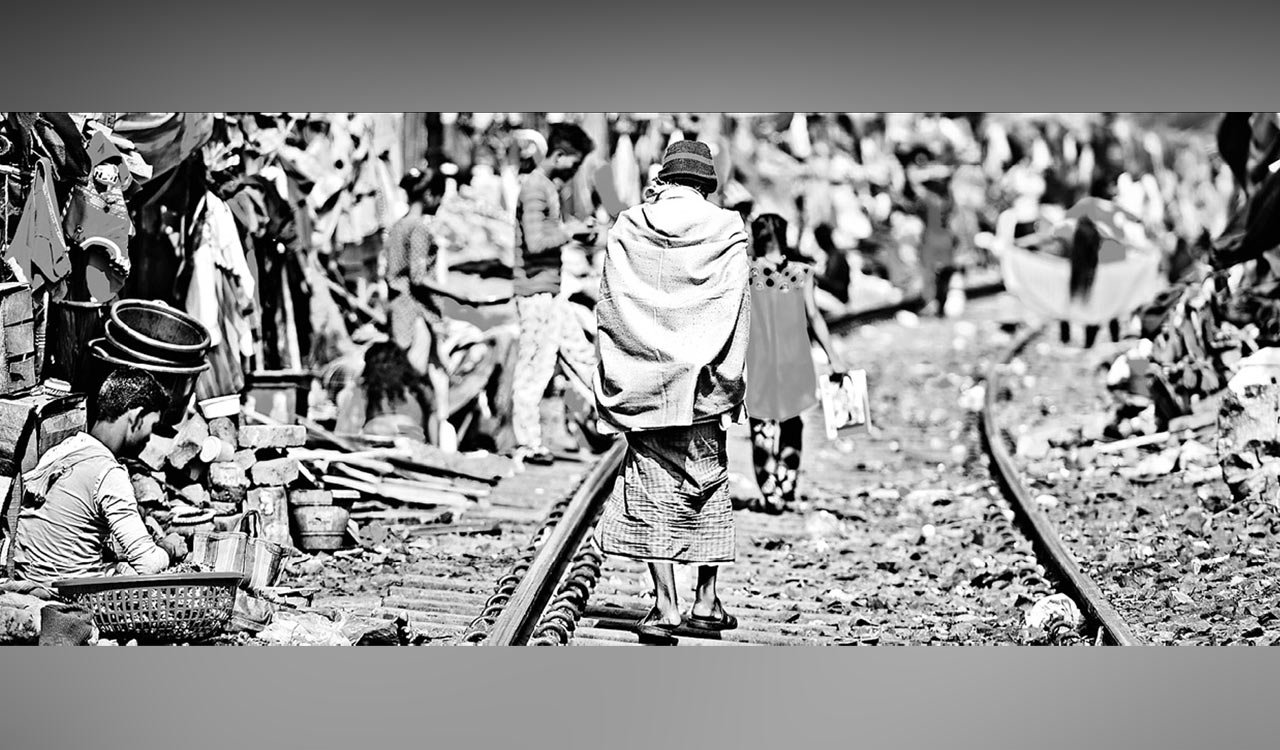
Despite the economic slowdown and sudden pandemic hit, a steep reduction in poverty raises several doubts and questions over the methods and results of these reports.
Unconvincing Methodology
First, the reports are drawn around a multidimensional poverty index, composed of developmental and non-economic dimensions (Health, Education, and Living conditions), which shows the number of multidimensionally poor people.
Second, the NITI Aayog’s report has been prepared based on National Family and Health Survey 2019-21 (NFHS-5) data, in which the methodologies differ from traditional monthly consumption-based poverty estimation methodology.
Third, independent poverty estimations, such as by Subramanian and Mehrotra-Parida (2017), that are prepared using leaked withheld data from the Consumption Estimation Survey 2017 have reported a rise in the poverty headcount ratio.
Finally, in contrast to previous practices, the current regime is neither acting upon the last poverty estimation report (submitted in June 2014) by the C Rangarajan committee nor formally constituting a new poverty estimation committee. This ambiguity and unawareness of poverty estimates lead to relying on NFHS-based multidimensional and private poverty estimations. In any case, the actual condition of poverty in India is unknown in the absence of reliable consumption expenditure surveys.
The results of the reports are also contested on several grounds. One of the strong doubts over claims of a sharp decrease in the poverty rates in the second decade of this century is that India registered a four-decade-high unemployment rate in 2017-18, according to National Statistical Organisation (NSO) data. The non-farm employment rate has also dropped from 2013, (on average only 2.9 million jobs have been
created per year till 2019). Also, the GDP growth rate started witnessing a fall from 2016 and dipped to negative during the Covid pandemic.
No Reliable Estimates
However, on the support side, improvements in several living conditions aspects such as the use of LPG, access to electricity and drinking water, and sanitation are said to be reasons for the fall in multidimensional poverty. Also, a rise in life expectancy, schooling years and a fall in population growth rate are cited as an impetus in accelerated poverty alleviation.
The government must bring out reliable and official poverty estimates by starting a consumption expenditure survey to settle this debate and table poverty conditions in the country. This method is arguably the most accepted method due to its ability to bypass shortcomings of other poverty estimate methods, such as income-based poverty estimation where the BPL survey relies on households’ self-reported annual incomes to determine the poverty line.
It also detours the calorie-based calculation of poverty, in which food expenses are over-emphasised. Though the multidimensional poverty approach has several positives and plurality, it should not be substituted entirely for other poverty estimations. It is possible to understand the overall plight of poverty only when it is estimated and explored from all the possible dimensions, along with cognizance of every single aspect.
Long Journey
Poverty remains a significant constraint hindering India’s development. Numerous programmes to tackle this issue have been implemented post reforms, but their success and impact are essential to gauge. Achievements so far highlight the need for inclusive development and a last-mile approach, striving for an equitable society under the vision of ‘Sabka ka Saath, Sabka ka Vikas’ (prosperity for all).
However, eradicating poverty, as envisioned in Sustainable Development Goal 1, is a long journey. Continuous growth, reliable data, and wealth redistribution are crucial to reducing inequality gaps and eradicating poverty. The comprehensive understanding of a country’s development lies in the interplay of Poverty, Inequality, and Growth (PIG).